
HOW IT WORKS
How we measure commerce media incrementality
Direct integrations, a commerce graph, an ensemble causal model and a daily learning loop. All feeding signals back into the platforms that run your media.
WHAT IT DOES BEST
Three principles run through every step.
/ 01
Causal Inference
Multiple causal techniques link investment to outcome, not the click that came last.
/ 02
Continuous Learning
Daily retraining keeps insights fresh, not stuck on last quarter's reality.
/ 03
Speed & Granularity
Reporting down to the campaign and line item, ready to drill down or roll up.
01
INTEGRATIONS
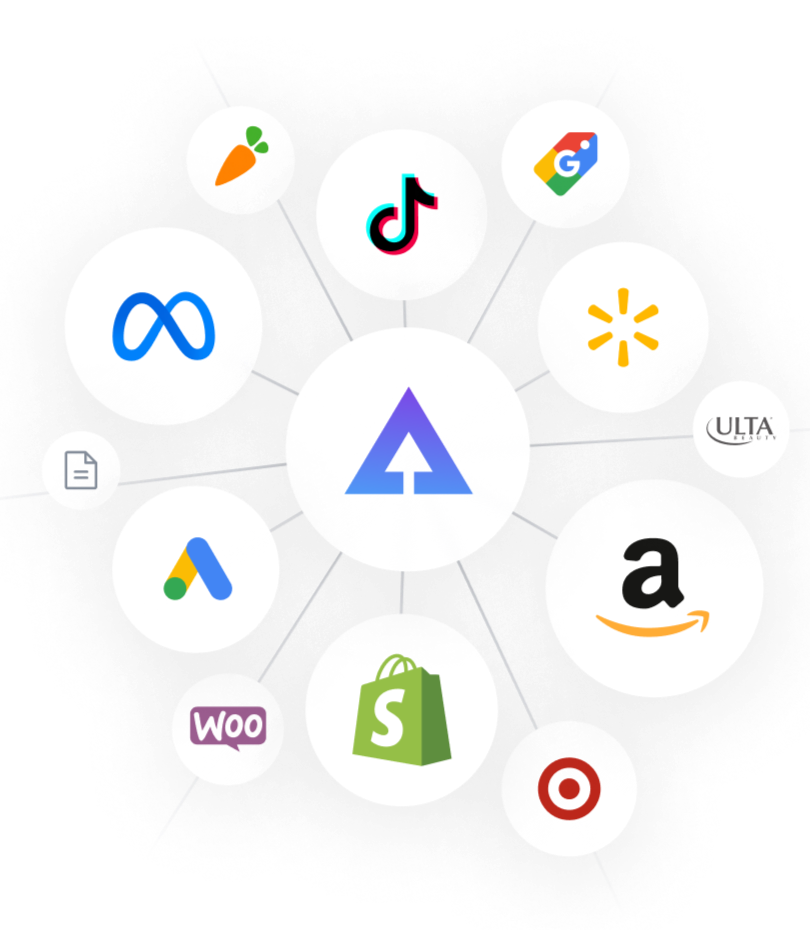
Direct connections to retailers, media, and the digital shelf.
A few clicks connects you to retailer and platform data with out-of-the-box connectors, or bring your own data.
02
CLEANSING & NORMALIZATION
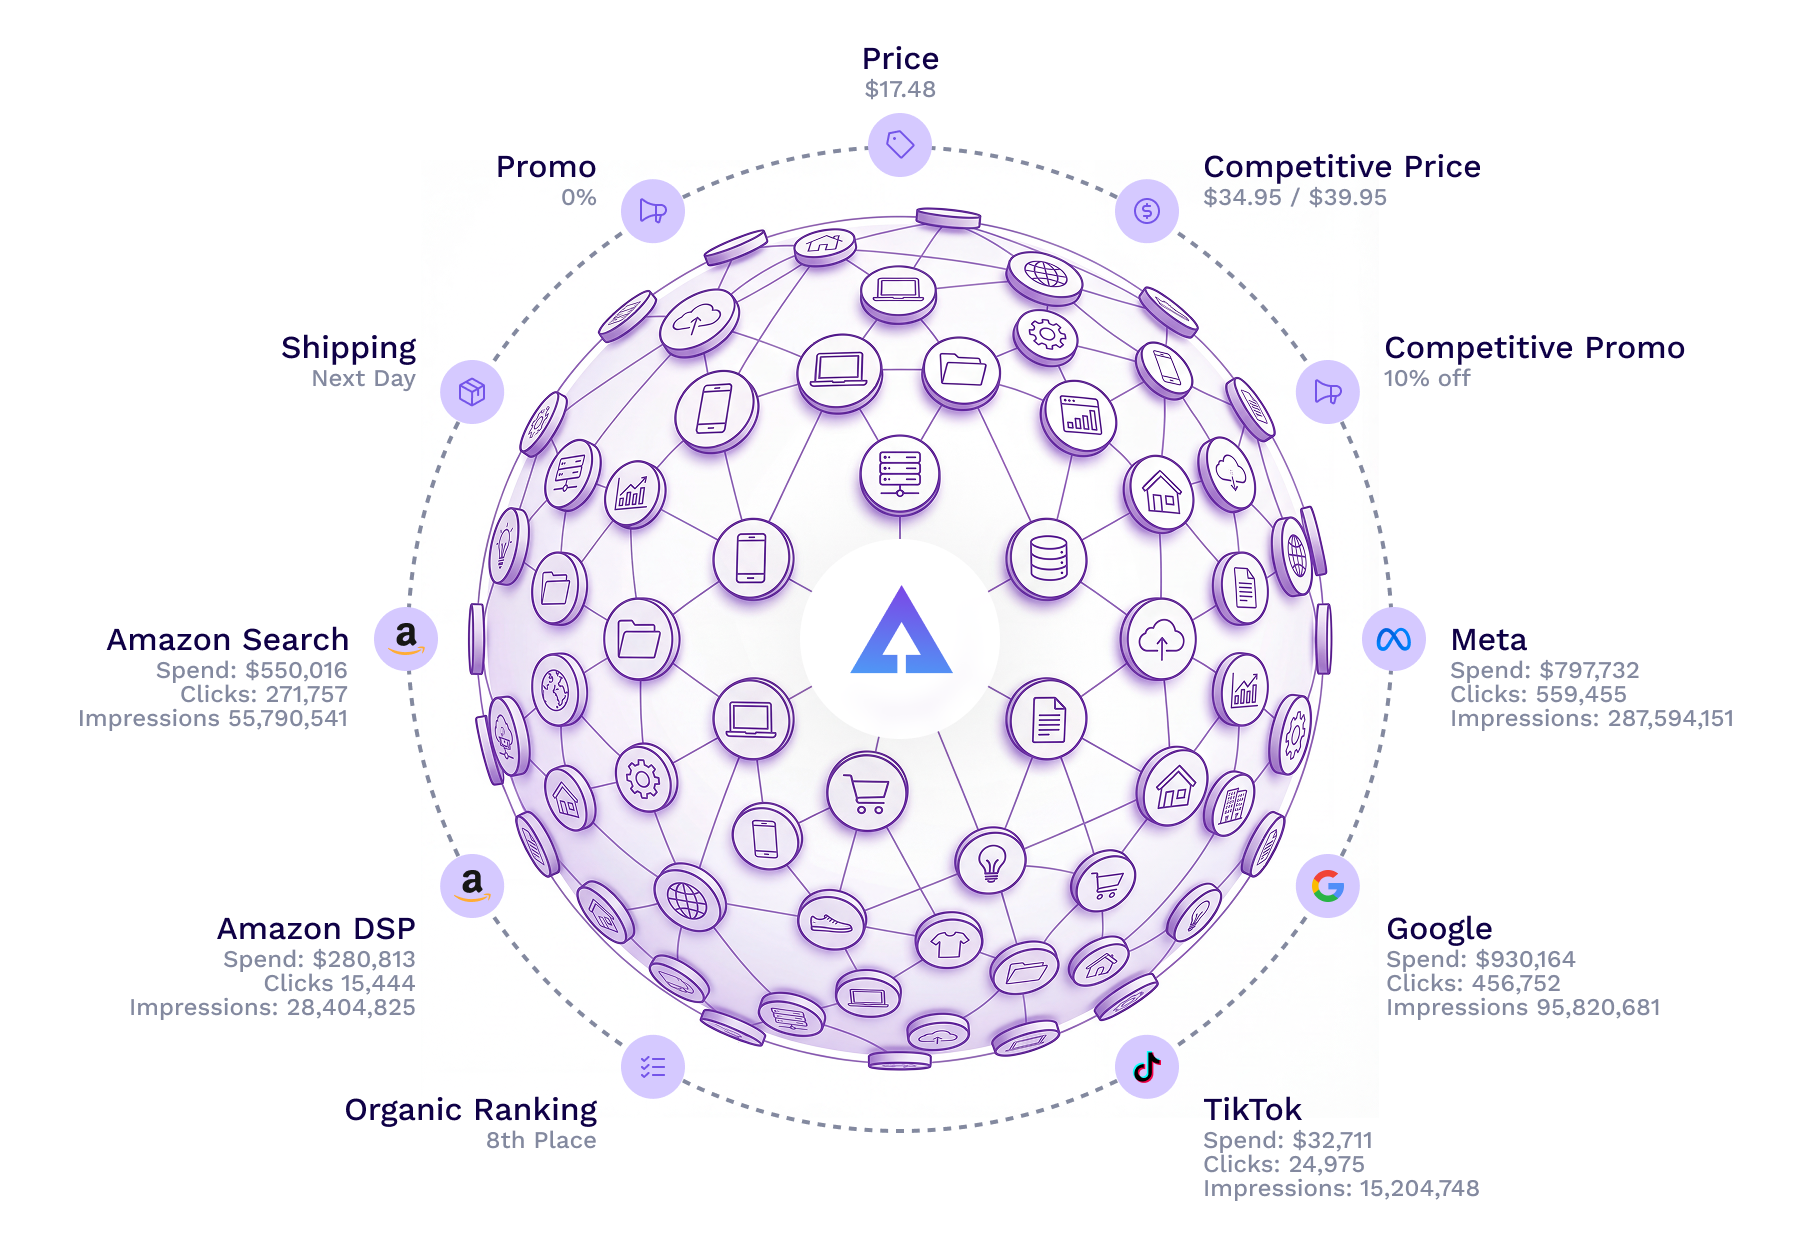
A graph that maps every product, campaign, promo, and shelf signal.
The commerce graph is the foundation. It links what each campaign targeted to where products were on promotion and how they appeared on the digital shelf. AKA, the context generic measurement skips.
03
UNTANGLING INCREMENTALITY
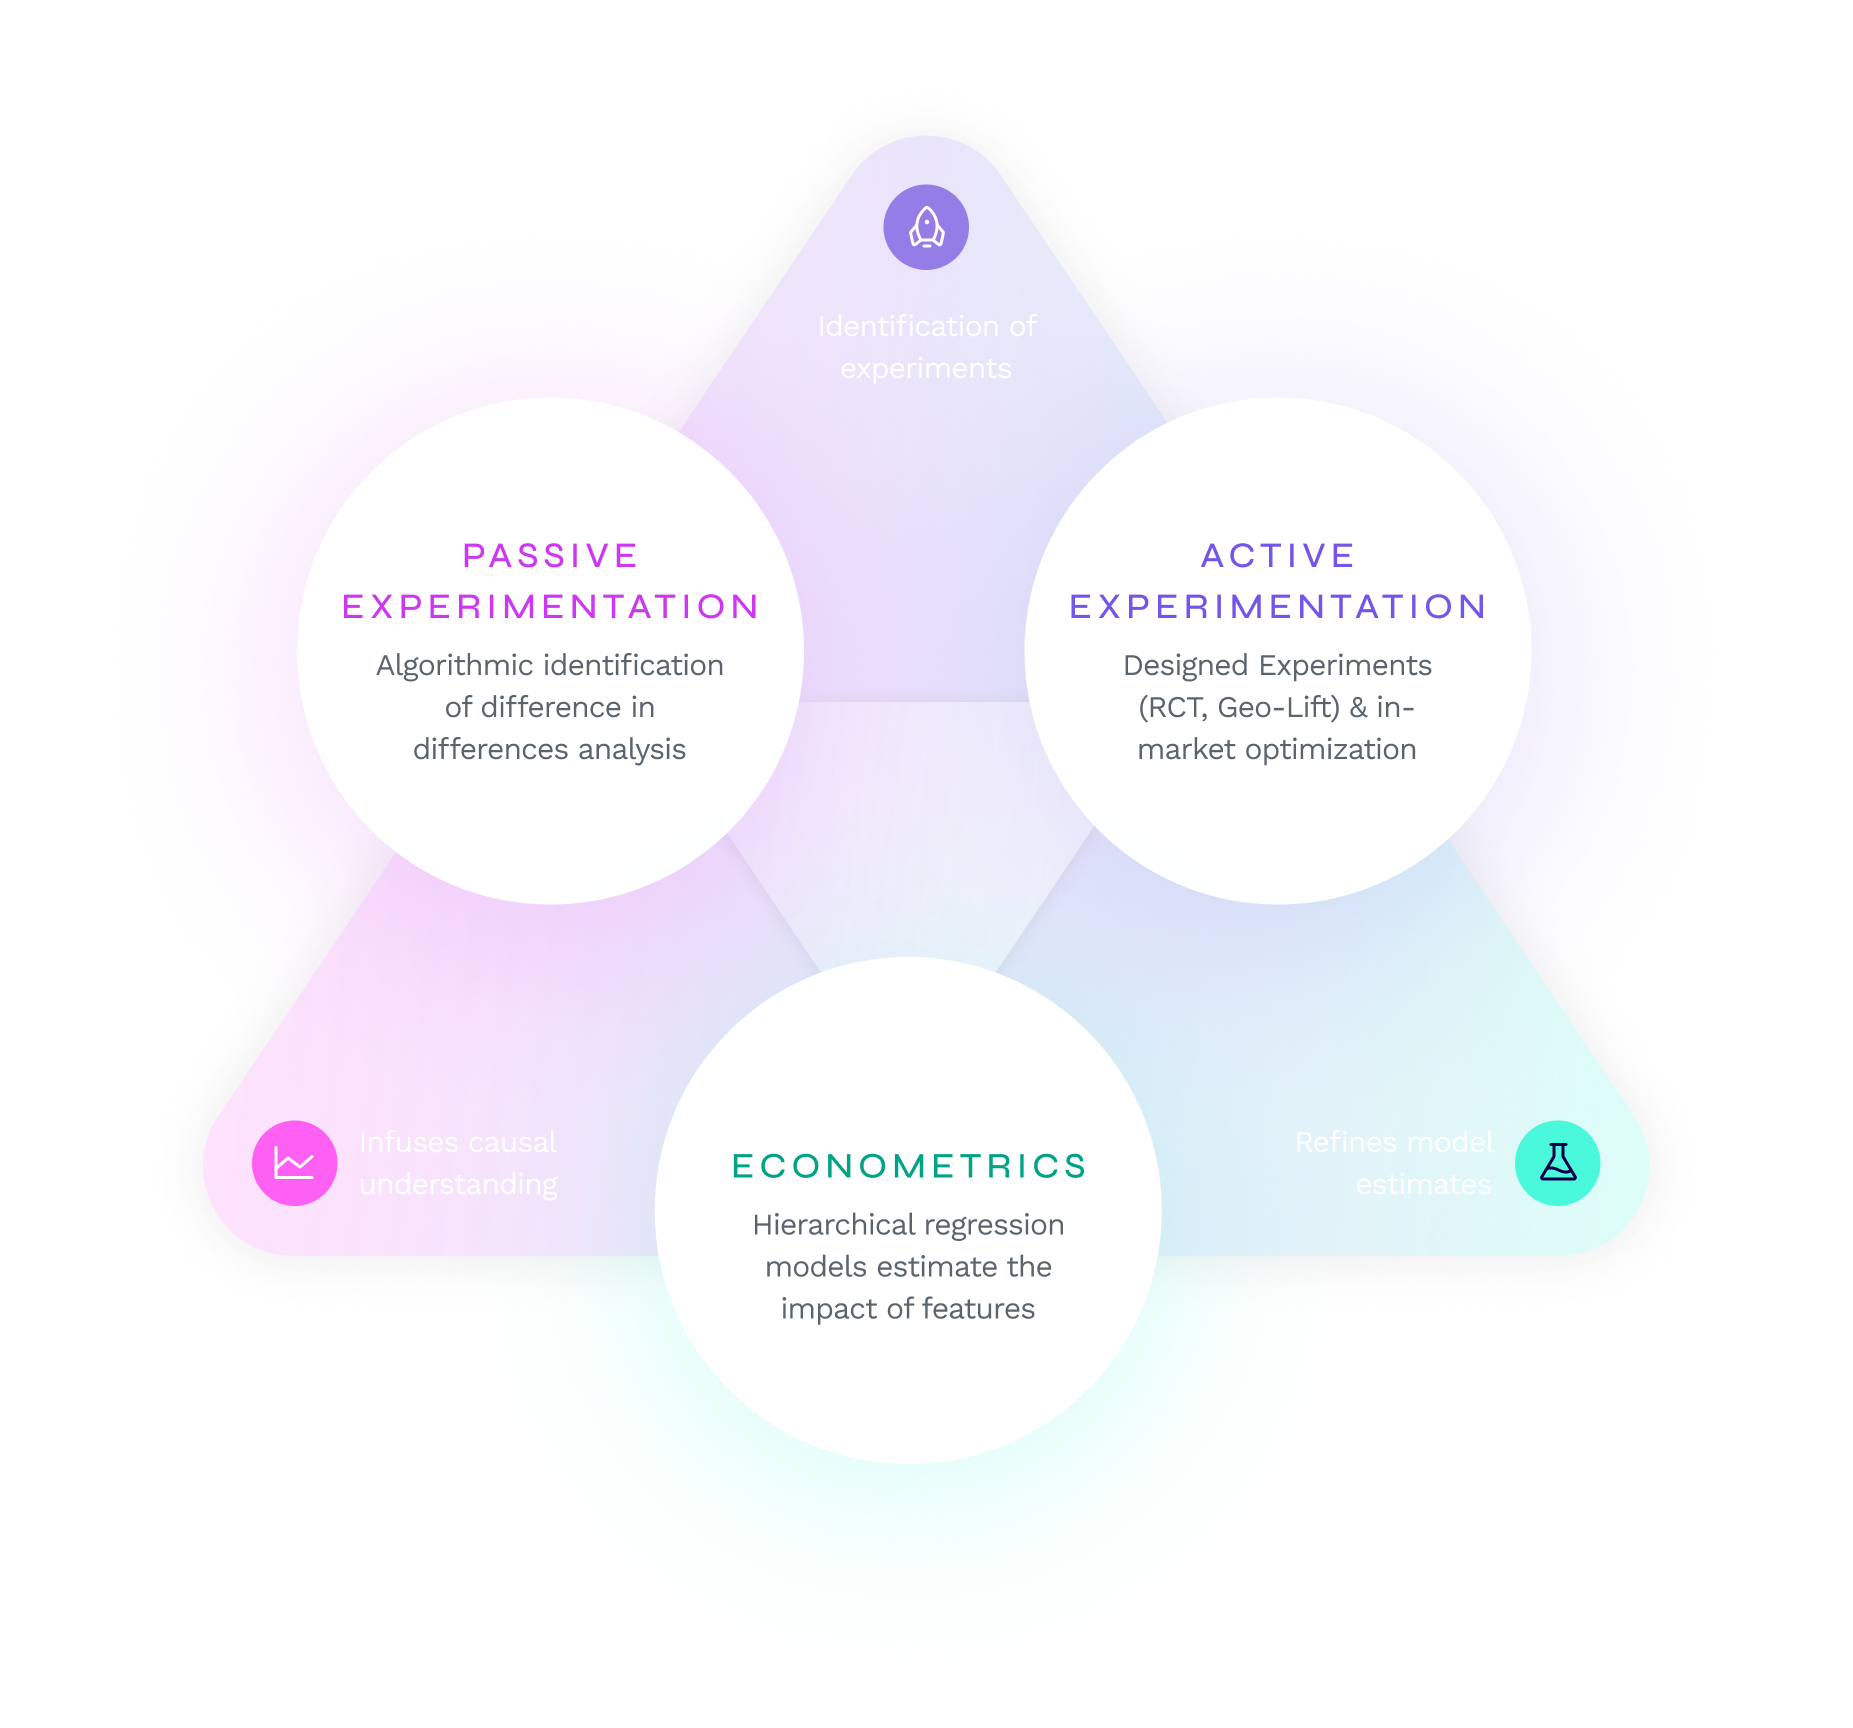
An ensemble causal model decomposes sales into what caused them.
Econometric techniques combined with designed and synthetic experiments separate media impact from other factors by retailer and channel, down to the line item.
04
CONTINUOUS LEARNING
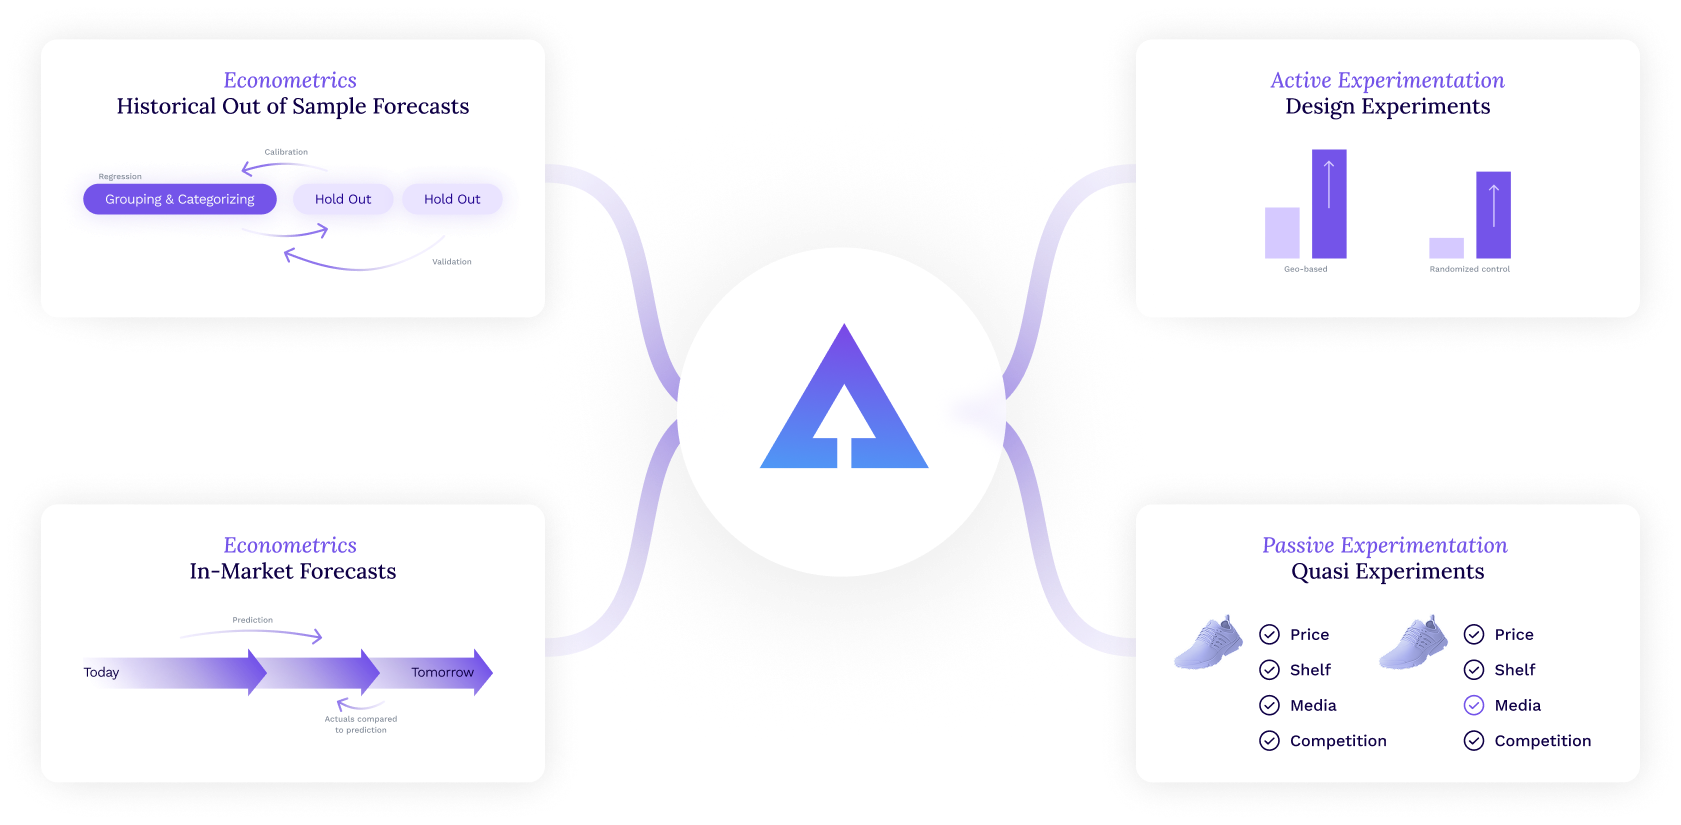
Daily retraining keeps the model in sync with the business.
Short-term predictions are compared to actuals on a daily basis, and the delta becomes feedback. Recency bias is intentional: smart decisions require fresh data.
05
DATA SHARING
Signals flow into the platforms that already run your media.
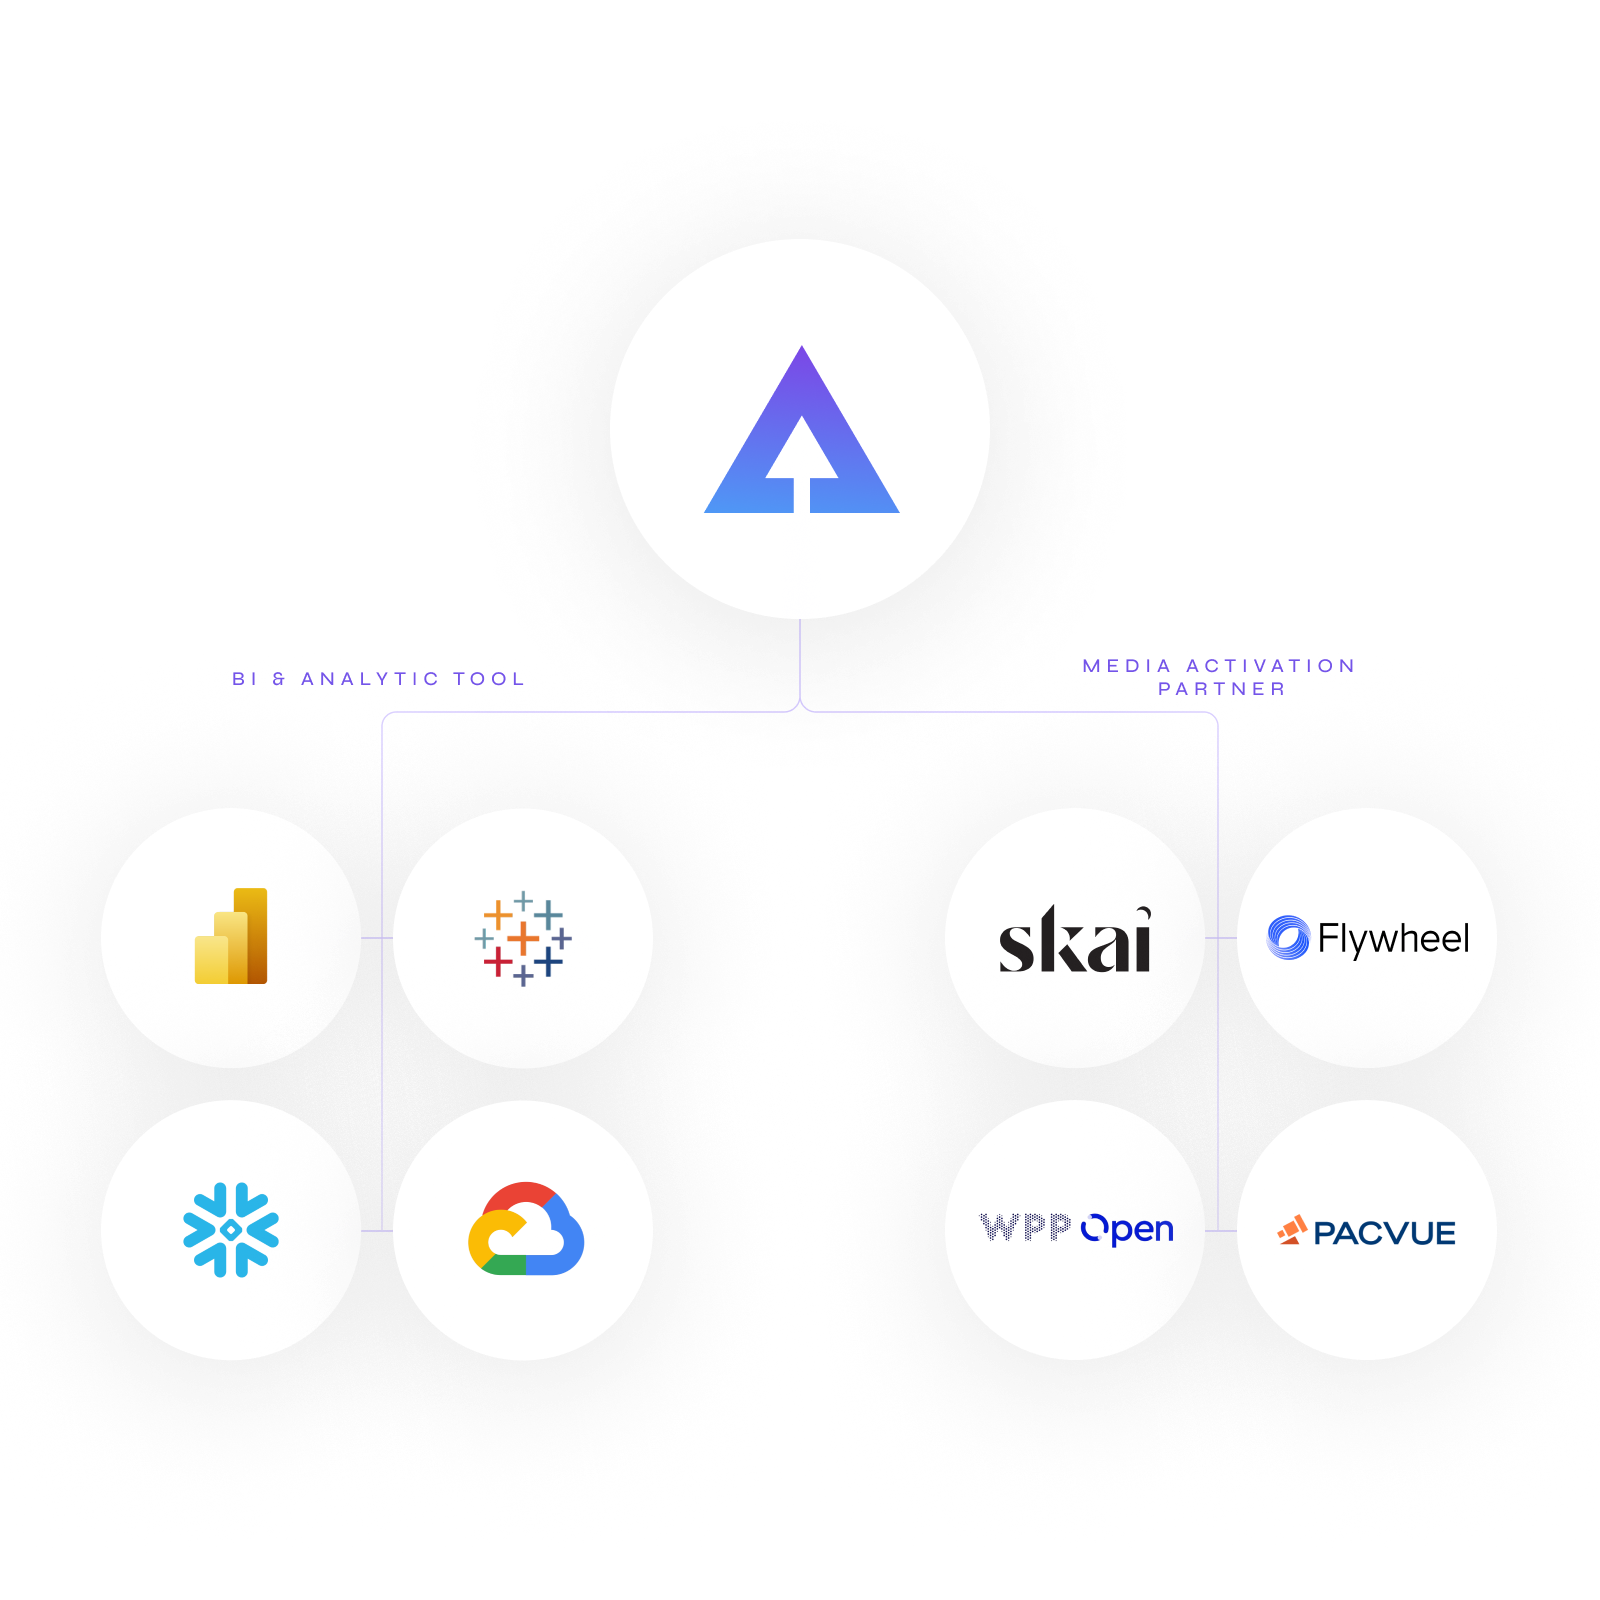
Direct API integrations with omnichannel media buying platforms to enable incrementality signals and recommendations to flow seamlessly into campaign management workflows. We can also drop it into your internal data lake, or just send you a daily email.
Discover incremental growth.
Let us show you how we help brands grow sales across retailers.